The Art of Streetplay

Thursday, September 29, 2005

What We Can and Cannot Take Away From Clinical Studies Regarding Investments; A Generalization

An interesting way to increase the information set from which we make judgements on human judgement relative to quantitative estimation in an investment framework is to, of course, draw on similar comparisons from other disciplines.

One such discipline is clinical studies (props to Kelvin for the article). A number of papers have dived into comparisons of the two, making clear that much of the estimation currently done in the medical field by doctors and the like should actually probably be made through actuarial methods. The bottom line, it seemed, was that actuarial methods dominate their clinical counterparts in almost every study that has been performed. The tests usually consist of assessing the probability of having a machine and a clinician make a judgement about the nature of a person's illness given the same dataset, and comparing the respective frequencies. Even when clinicians are given an informational advantage, they still don't beat their machine counterpart. In many cases, the new information doesn't help them at all.

I would encourage people read some of the findings-- it's really interesting stuff! But before everyone goes off and becomes quants there are a few things that should be noted; the caveat is that investing is not the same as making a handful of prognoses at a hospital.
  • Unlike in a hospital setting where everyone needs to get diagnosed (deferring judgement isn't an option), investors have the liberty to avoid that which they have no "edge" on. Charlie Munger comes to mind. In some ways he does precisely the opposite of what the clinician is told to do. He sits on his hands and waits until he sees what he perceives to be a huge opportunity and he puts on a position in size. Market making is another story.
  • Incidentally, this is why I think many rapid fire trading strategies tend to be short vol. Processes assume a certain set of statistical properties until they don't. Shocks to the system and regime shifts don't lend themselves well to automated models, which might have a difficult time assessing when it's time to re-evaluate the model. I would tend to say along these lines that Charlie Munger's methodology is long vol.
  • Liquidity removes some of the comparability between the two fields. In some sense I guess there is no liquidity in the medical world-- you make the choice, then are subject to a binary outcome-- yes or no. In the markets it has implications on competition and hence efficiency, transaction costs, market impact, etc.

That being said, some of the criticisms of clinician's assessments reminds me very strongly of the psychological biases subject to investors. Overconfidence when it isn't merited (being Fooled By Randomness), viewing historical events as more causal and less random than they actually were, the phenomenon of being flooded by data to the point that judgement is actually impeded, misconceived disdain for aggregate statistics, improper and randomly varying factor weighting... these are universal decision making problems.

Given the nature of the decisions being made by clinicians, it makes a lot of sense to me that a quantitative framework is more appropriate. That being said, I don't believe the same is necessarily true of the financial markets. Or perhaps I am being fooled by personal bias :)

-Dan

ps. In the same way that one goes about increasing ones information set by looking at comparable situations, the same can be said of stocks. Of course we all know the age old trick of looking at comps. I'm actually referring to estimating "comparability" by whipping out the time series of a stock with every other stock in the market and rank ordering them in terms of absolute value. Of course it might be of value to decrease the resolution of the series to get a more fitting view of reality. One may also want to make other adjustments. But the bottom line is this-- there are some stocks out there which have correlations over the past year that are literally up around 60%. This is ridiculously high. One will also find that certain industries just happen to correlate more than other industries. This has profound implications on our ability to make individual stock bets.

Why should I look at Beta? We look at Beta because our stocks tend to be positively correlated with the market. But if you actually do out the numbers, with daily resolution the absolute correlations are typically quite low. Betas of 1 or 2 or more are typically are a result of having a much higher relative vol.

Now imagine that you have a stock whose correlation with its industry is around 40 or 50%. Do I want to focus my attention on my one company? Perhaps, but from a risk management point of view, there are marked differences between this and a more statistically disperse industry.

Furthermore, correlation studies have implications on information gathering. And hedge effectiveness. But I will leave that up to my readers to think about.

Updates

I will be a bit on the busy side over the next few weeks. Good news-- I will be a guest speaker at an Information Systems/Information Management Seminar Series in the Operations Research Dept at the University of Pennsylvania on October 28th. Needless to say, the subject is, tentatively, "Web Mining, data integration and the stock market."

Hopefully I don't say or do something stupid, and more importantly, hopefully I actually have something which people might consider interesting!

Highlight of the week: Last Thursday, I got to shake Jim Simons' hand. Arguably the best hedge fund manager in existence. Quite an honor.

Monday, September 26, 2005

Our Worst Enemy is Ourselves

Our Worst Enemy is Ourselves

Prior to the internet, large scale privacy abuse was all but impossible.  When information was stored in physical documents at home, privacy abuse was simply too expensive to scale.  The same is not true for information stored on the internet.  The density of the internet’s network structure makes it very vulnerable to targeted attacks.  Voluntary or not, the social transition to internet connectivity will inevitably lead to a loss of personal privacy, especially as advertisers find increasingly innovative ways to exploit information about us and our social networks.  Much of what society now considers private will not be so in 20 years because of the internet.  

There are many legitimate arguments which run contrary to this notion.  We value our privacy very highly and have explicitly built it into our Constitution through the Fourth Amendment.  We have regulatory groups in place to enforce society’s privacy.  These groups have spurred on the creation of laws and acts like the Electronic Communications Privacy Act, declaring that email is a private means of communication and should be subject to the same level of privacy as phone calls and letters.  Technology has been created to proactively counter privacy abuse—encryption techniques have become more powerful, and an active market has been built around spam filters.  For each virus that has wreaked havoc on networks of computers, there has been an add-on created to neutralize it.  Speaking more broadly, our free market system itself has eliminated privacy abuse—problems of the past have created a consumer demand for protection, which in turn has led to the creation of electronic security companies to effectively meet this demand.

However, can we honestly say that we don’t want to give up our privacy under the right circumstances?  While it is indeed of value to us, history has shown that we are willing to voluntarily sacrifice privacy for functionality.  Gmail, Facebook, Google Search and VisiblePath are notable recent examples of this.  Gmail is perhaps the best free email service available today, with 2.6GB and a very useful search capability.  However its useful services come at the expense of privacy—Gmail has robots which scan all of our emails so that it can craft targeted advertisements.  Facebook allows students to connect more easily with friends, but asks students to voluntarily disclose personal information like phone numbers, email addresses and interests.  Google’s search engine vastly expands users’ ability to retrieve information.  Users tacitly compensate Google by allowing Google to bombard them with advertisements tailored by prior search history and location.  VisiblePath scours the social networks of employees systematically through their emails and address books to identify potential connections with other corporations.  This improves corporate efficiency at the expense of employee privacy.  137M US citizens, 45% of the current US population, use the internet. 84% of these users regularly use search engines like Google, and 92.5% regularly use email services like Gmail.  These percentages will inevitably continue to grow, making it all the more profitable for companies and advertisers to innovate and expand their offerings.  Are we going to enact regulations we don’t want to enact?  Is the free market system going to create products that respect user privacy but have no consumer demand?  Our problem, if it is even valid to call it one, is that we want to give up our privacy.  

Sunday, September 25, 2005

Yahoo Stock R Mining Functions

Here are some functions which may be of use to those of you who use R.  Gotta do my part for the open source movement!  Pretty tame. "yimp" gathers price data for an arbitrary number of stocks over an arbitrary time period.  "ksImport" gathers a handful of key statistics for whatever stocks you want and throws them into a list.  Check it out.  If anyone has any follow-ups, corrections or comments please feel free to email me.
-Danny

#Yahoo Price History Gatherer -- for example, yimp(c("IBM","GE"),20050101,20050901)

yimp <- function(ticker.list,start.date, end.date, data=TRUE, plot=FALSE){
     Source = "http://ichart.finance.yahoo.com/table.csv?"
     startmonth <- as.numeric(substring(start.date,5,6))-1
     endmonth <- as.numeric(substring(end.date,5,6))-1
     nstocks <- length(ticker.list)
     for(i in 1:nstocks){
          if(startmonth <10){
               startmonth <- paste("0",startmonth,sep="")
               }
          if(endmonth <10){
               endmonth <- paste("0",endmonth,sep="")
               }
          Query <- paste("&a=", startmonth,"&b=", as.numeric( substring( start.date,7,8) ),"&c=", as.numeric( substring( start.date,1,4)),"&d=", endmonth,"&e=", as.numeric( substring( end.date,7,8)),"&f=",as.numeric( substring( end.date,1,4)), "&g=d&ignore=.csv",sep="")
          download.file( url=paste( Source,"&s=",ticker.list[i],Query,sep=""),destfile= "tempfile",quiet=TRUE )
          temp<- read.delim("tempfile",sep=",",as.is=TRUE,fill=TRUE)
          temp <- temp[,c("Date","Adj..Close.")]
          colnames(temp) <- c("Date",ticker.list[i])
          time <- sub("-","",sub("-","",temp[,"Date"]))
          tempnames <- colnames(temp)
          temp <- data.frame(strptime(time,"%d%b%y"),temp[,2])
          colnames(temp) <- tempnames          
          if(plot==TRUE){
               windows()
               plot( x=temp[,"Date"], y=temp[,ticker.list[i]], type="l",col="blue",lwd=1, main=paste("Prices for ",ticker.list[i]," from ", temp[1,1]," to ",temp[nrow(temp),1],sep=""), xlab=paste("Date",sep=""), ylab="Price")
               end <- nrow(temp)
               mid <- mean(temp[,ticker.list[i]])
               sdup <- mean( temp[,ticker.list[i]]) + sd(temp[,ticker.list[i]])
               sddown <- mean( temp[,ticker.list[i]]) - sd(temp[,ticker.list[i]])
               lines(c( temp[1,1],temp[nrow(temp),1]),c(mid,mid), col="red",lwd=2)
               lines(c( temp[1,1],temp[nrow(temp),1]),c(sdup,sdup), col="red",lwd=1)
               lines(c( temp[1,1],temp[nrow(temp),1]),c(sddown,sddown), col="red",lwd=1)
               }
          if(i ==1){
               list <- temp
               }
          if(i !=1){
               if(nrow(temp)>nrow(list)){
               #if the temp is larger than list, then set the temp dates as the list dates, append to all
               #columns in the small list NA's until they match in length to temp, then append temp to the
               #end.
                    list2 <- list
                    list2names <- colnames(list)
                    tempnames <- colnames(temp)
                    list <- temp[,1]
                    oldlength <- nrow(list2)
                    for(k in 2:ncol(list2)){
                         newtemp <- as.numeric( append(list2[,k],rep("NA",(nrow(temp)-oldlength))))
                         list <- data.frame(list,newtemp)
                         colnames(list) <- c(colnames(list)[1:(k-1)],list2names[k])
                         }
                    colnames(list) <-c( tempnames[1],colnames(list)[2:ncol(list)])
                    list <- data.frame(list,temp[,2])
                    colnames(list) <- c( colnames(list)[1:(ncol(list)-1)], tempnames[2])
                    }
#Note: this makes the assumption that up until we have no price data for a particular stock, all stocks in
#the set trade on the same days. This will be true almost all the time, except for instances in which a
#particular stock is forced to cease trading (for example, for regulatory reasons).  I have yet to see an
#instance of this, but it could very well happen I would imagine, unless yahoo corrects for this.
               if(nrow(list)>nrow(temp)){
                    tempname <- colnames(temp)
                    newtemp <- as.numeric( append(temp[,2],rep("NA",(nrow(list)-nrow(temp)))))
                    list <- data.frame(list,newtemp)
                    colnames(list) <- c( colnames(list)[1:(ncol(list)-1)],tempname[2])
                    }
               if(nrow(temp)==nrow(list)){
                    list <- data.frame(list,temp[,ticker.list[i]])
                    colnames(list) <- c( colnames(list)[1:(ncol(list)-1)],ticker.list[i])
                    }
               }
          }
     if(length(ticker.list)>=3){
          list <- list[,-4]
          }
if(data==TRUE){return(list)}
}


#Key Statistics Importer -- Grab a handful of Key Statistics (ie. ksImport(query="IBM"))


ksImport <- function( file = "tempfile",source1 = "http://finance.yahoo.com/q/ks?s=", source2 = "http://finance.yahoo.com/q/in?s=",query){
pointer <- ":</td"
offset = 2
nstocks <- length(query)
keynames = c( "Market Cap ", "Enterprise Value ", "Trailing P/E ", "Forward P/E ", "Price/Book ",
      "Enterprise Value/EBITDA ", "Trailing Annual Dividend ", "EBITDA ", "Net Income Avl to Common ",
      "Revenue ", "Total Cash ", "Total Debt ", "Average Volume ",
      "Shares Short ", "Shares Outstanding:")
      temp = as.character(Sys.Date())
stats <- matrix(0,(length(keynames)+2),nstocks)

for(j in 1:nstocks){
     temp = as.character(Sys.Date())
     url1 = paste(source1, query[j], sep = "")
     download.file(url1, file, quiet=TRUE)
     x = scan(file, what = "", sep = ">")
     if(length(grep("no longer valid",x))!=0){
          query[j] <- strsplit(x[grep("no longer valid",x)],split="?s=")[[1]][2]
          url1 = paste(source1, query[j], sep = "")
          download.file(url1, file, quiet=TRUE)
          x = scan(file, what = "", sep = ">")
          }
     if(length(grep("There is no  data available",x))!=0){
          stats[,j] <- "NA"
          }
     if(length(grep("Invalid Ticker Symbol",x))!=0){
          stats[,j] <- "NA"
          }
     if(query[j]==""){
          stats[,j] <- "NA"
          }
     if(sum(nchar(x)>15000)!=0){
          x <- strsplit(x[nchar(x)>15000],split=">")[[1]]
          }
     if(query[j]!=""){
     if(length(grep("There is no  data available",x))==0){
     if(length(grep("Invalid Ticker Symbol",x))==0){
          for (s in keynames) {
               loc <- grep(s,x)
               if((s=="EBITDA ")&(length(loc)!=1)){loc <- loc[2]}
               if((s=="Revenue ")&(length(loc)!=1)){loc <- loc[2]}
               if((s=="Total Cash ")&(length(loc)!=1)){loc <- loc[1]}
               if((s=="Average Volume ")&(length(loc)!=1)){loc <- loc[1]}
               if(( s=="Trailing Annual Dividend ")&(length(loc)!=1)){loc <- loc[2]}
               if((s=="Shares Short ")&(length(loc)!=1)){loc <- loc[1]}
               if(length(grep(pointer,x[loc]))==1){
                    grepped = paste(sub("</td", "", x[loc + offset]))
                    }
               if(length(grep(pointer,x[loc]))==0){
                    i=1
                    while(length(grep(pointer,x[loc+i]))==0){
                         i <- i+1
                         }
                    grepped = paste(sub("</td", "", x[loc +i+offset]))
                    }
               temp = c(temp, grepped)
                       }
          url2 = paste(source2,query[j],sep="")
          download.file(url2, file, quiet=TRUE)
          x = scan(file, what="",sep=">")
          s="Industry:"
          grepped = paste(substring(sub("</b", "", x[grep(s, x)][2]),11))
          temp = c(temp, grepped)
          stats[,j] <- temp
          }
          }
          }     
     }
for (i in 1:length(keynames)) {keynames[i] = substr(keynames[i], 1, nchar(keynames[i]) - 1)}
        keynames = c("Date", keynames,"Industry")
        output <- data.frame(cbind(Keyname = keynames, Statistic = stats))
     colnames(output) <- c(colnames(output)[1],query)
     #tidying up the format
     output <- t(output)
     colnames(output)<- output[1,]
     output <- output[-1,]
     names <- colnames(output)
     if(length(query)==1){
          output["Industry"] <- sub("&","&",output["Industry"])
          if(output["Trailing Annual Dividend"]==""){output["Trailing Annual Dividend"] <- 0}
          output["Trailing Annual Dividend"] <- sub("%","",output["Trailing Annual Dividend"])
     }
     if(length(query)>1){
          output[grep("&",output[,"Industry"]),"Industry"] <- sub("&","&",output[grep("&",output[,"Industry"]),"Industry"])
          output[output[,"Trailing Annual Dividend"]=="","Trailing Annual Dividend"] <- 0
          output[grep( "%",output[,"Trailing Annual Dividend"]),"Trailing Annual Dividend"] <- sub("%","",output[grep("%",output[,"Trailing Annual Dividend"]),"Trailing Annual Dividend"])
          output <- data.frame(rownames(output),output)
          colnames(output) <- c("ticker","date","mktcap","EV","PEttm","PEfwd","PtoB","EVtoEBITDA","DivYld",
               "EBITDA", "NetIncome","Revenue", "TotCash","TotDebt","AvgVol", "TotShort","TotShares","Industry")
          }
return(output)
}


Wednesday, September 21, 2005

IXDP is now WisdomTree Investments (WSDT.PK); Deeper Look at PowerShares

[Dated post-- most recent update on WSDT on June 20th 2006 is here]

It's official.

PowerShares-- Bulking Up Its Management Too?
Interestingly enough, it seems that PowerShares is in some ways following WSDT and upping that management team. They hired Benjamin Fulton as SVP of Product Development and Edward McRedmond as SVP of Portfolio Strategy.

Taking a Look at Fulton:
Surprisingly enough, Fulton spent some time at Nuveen Investments. As a side note, WSDT has had some background with Nuveen if I remember correctly; I believe one of their earlier index ideas was in some way related to something Nuveen had created. Thankfully no lawsuits were thrown (I guess WSDT was in the right!). Needless to say nothing came of those indices so nothing to worry about on that front.

The article linked above mentions his being an MD at Nuveen with a focus on product development. Will most likely be a big logistical help for PS. That being said, Nuveen is an ETF sponsor and has introduced ETF's of its own, which begs the question. Might it be a little more helpful to hire someone with some real ETF experience, especially if you are poaching an ETF sponsoring firm like Nuveen? If he had any direct ETF background, they would have said so in the articles I would imagine.

Bottom line IMHO is that this is definitely a step up for PS. Fulton is nothing to shake a stick at. But it might have been nice to have had a little more ETF-specific experience. His background in bringing products to market puts him in a position similar to Morris at WSDT. I like Morris more.

Taking a Look at Edward McRedmond:
The article linked to above speaks to McRedmond's background pretty thoroughly. He seems to have done some solid analysis of the ETF space and probably has a stronger grasp of the product than most people. Only question I have about him is why, after a full 17 years at AG Edwards, he couldn't move any higher than Associate Vice President. At Citigroup, time-adjusted, this doesn't amount to a super ton.

Getting a Better Picture of PS's ETFs:
They've got around 23 ETF's in total which they basket into four flavors.

A Closer Look at PS's Dividend ETF Portfolio:
One very popular flavor is dividends, the oldest of which is PEY, the High Yield Equity Dividend Achievers ETF. They now have 4 dividend-based ETF's in total-- the other three are the International Dividend Achievers (PID), Dividend Achievers (PFM), and High Growth Rate Dividend Achievers (PHJ). Statistics on these portfolios are contained below.

Enough with the boring details-- can you guys see anything interesting about the historical performance statistics? This is not too hard to see.


... the historical performance of the newly created ETF's suck, unless I'm really missing something. The Sharpe for the flagship PEY knocks the freaking socks off of the three new ETF's. And at the same time, the historical Beta is around half that of the newbies! They are publicly announcing this themselves?

This begs the question-- why the hell should I invest in these other funds if the performance is so much worse, even in the past??? You can trade all the options you want on these things (yes, on the AMEX you can trade options on the newbs), but returns will not magically appear. Pile onto that the fact that the newbs are probably far more illiquid, and all I can see is a pretty bad deal. But hey, maybe I'm missing something. Moving on!

Other ETF's in the Portfolio:

PS also has a large basket of industry-specific ETFs (ie. Biotech&Genome portfolio, Food&Beverage, Leisure&Entertainment, Pharmas, ...) and another basket of style-specific ETF's (ie. Value, Growth, varying cap ranges). They have two funds which track the broader market with the Intellidex Enhancement. Finally, they've got a couple of weird ones which don't really fit into any of the above classifications (a China ETF and an alternative energy ETF). The China ETF is basically filled with a bunch of ADRs. I honestly haven't done too much about it, except that it's pretty heavily weighted towards oil right now. Me being my usual cynical self, I will just throw a points out here to jab at this China ETF a little, and open up to discussion why this may be the case. Will leave the rest for another day.

Here are hypothetical historically backtested results for "Dragon Halter": Beta is 1, Sharpe is 1.02, Correlation is 0.5. All statistics are based on the past 3 years relative to the MSCI EAFE, which is supposed to be representative of foreign stocks. As expected, these hypothetical statistics handily beat the MSCI EAFE, which has a sharpe of 0.14 and a beta and correlation, by default, of 1.

They then show their hypothetical performance over the past year, and their actual performance since inception, as of June 1st 2005. No statistics given for these time periods, except that the performance was markedly worse. Over the past year they had a theoretical return of 4.92%, lagging the S&P and the EAFE. Since actual inception, they have lost money and are currently down 5.40%, while the EAFE and the S&P are up 9.87% and 1.17% respectively. Past performance is not indicative of future results; it seems for this China ETF, we may not even want the hypothetical past performance at all.

Fundamental Indexing
Last thing I thought I would bring up is Bob Arnott from RA. I wrote about him a while back myself. To recap, I was highly impressed with his study. That being said, it seemed he didn't fully flesh out statistics driving the implied investment thesis pertaining to mean reversion.

Well, apparently PS (in addition to Allianz) is jumping on the idea and creating an index around Arnott's research. The expense ratio will be 60 basis points which isn't bad. That being said, something tells me Arnott will be the winner in this one, making some serious jack on the licensing fees off of two companies. Should one get off the ground (doesn't matter to him which one, which would explain his licensing to two companies), he will probably be collecting a nice little check.

So What Is WSDT Thinking About?

Looking back, there have been a handful of strategies mentioned in studies done by Professor Siegel. One, incidentally, was a dividend study. I guess that space seems taken! The other was a study showing the historical performance of the original stocks in the Dow I believe, and how they haven't done all that badly if one were to reinvest dividends, reinvest gains from acquired companies, etc etc. I am doubtful that they would somehow base a strategy off of this.

And with Arnott essentially throwing his strategy out among ETF sponsors for them to tear at eachother, I am not too sure they can really do much with a cap-adjustment strategy.

Index volatility-dependent autocorrelation trading anybody? What do you think Chilton? ;)

That's the latest from me on the enhanced ETF space.

Monday, September 19, 2005

Commentary On The Trouble With Value

I'm sure the vast majority of you guys have read this already, but I find this sort of analysis to be really cool. I don't have a ton of time so I will briefly sum the paper up with some bullets and graphs before making some comments of my own.

Fact #1: The Market Has it Mostly Right-- P/E Ratio is, in fact, one of the best indicators of relative 1 year forward earnings.
-The graph below sums this one up nicely. What it says, for example, is that when the P/E ratio was in the bottom 10% of its history, earnings growth is 23% below average, and conversely when the P/E ratio was in the top 10% of its history, earnings growth was 26% above the mean. I assume they either took the P/E ratio of the market with annual sampling over its history, or they took all companies available at all years, and annually sampled their P/E ratios. The latter might be subject to survivorship bias conditional on the integrity of the dataset.


Fact #2: Value Stocks have indeed outperformed the market historically

The graph below makes this clear. What it doesn't show, though, is how volatile this outperformance has been, which is where things start to get interesting. For those who are looking at this for the first time, what it says, for example, is that if all stocks over all years were thrown into buckets ordered by their P/E ratios, and one were to calculate next year's return relative to the market return that year, the highest bucket underperformed the market on average by 2%, while the lowest bucket outperformed the market by 3%.

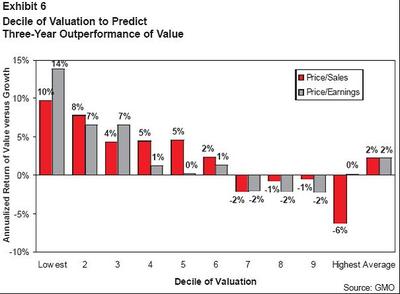
So what GMO did to dig into this a little more was compare the Russell 1000 Growth index versus the Russell 1000 Value index. The author assumes this to be a good proxy for value versus growth, so perhaps one might want to know exactly what the difference is between the two:

Russell 1000® Growth Index: Measures the performance of those Russell 1000 companies with higher price-to-book ratios and higher forecasted growth values. Is constructred to provide an unbiased barometer of the large-cap growth market.

Russell 1000® Value Index: Measures the performance of those Russell 1000 companies with lower price-to-book ratios and lower forecasted growth values.

I would give Russell the benefit of the doubt on this one, but it should be noted that its index doesn't appear to be constructed perfectly on the basis of Price to Book, and perhaps only loosely based on Price to Earnings or Sales.

GMO's piece then delves entirely into statistics on P/S and P/B, with P/S, the metric providing the most "trouble with value" but in some sense the least valid at least relative to P/E, explained first.

This begs a question and a hypothesis.

  1. If the comparison of R1000V versus R1000G is our proxy for value versus growth and both are primarily based on P/B, why would GMO adjust valuations using P/S and P/E? To be totally consistent, if they are going to adjust by P/S, they should construct an alternative index which splits out stocks into 2 buckets based on P/S. Same goes for P/E and P/B. To do otherwise is inconsistent, even though the results may very well be similar!
  2. It seems to me that the P/S example was put forth first because it elicited the most "trouble with value." It should be noted that Rob Arnott, in his construction of a more "pure" S&P index in that really really awesome paper he wrote a while back, P/S simply wasn't as good a representative index than P/E or P/Cash Flow, if I remember correctly. So this coupled with the lack of consistency mentioned in (1) lead me to wonder whether things are necessarily as bad as they appear for value.

Fact #3: Given the recent major outperformance of value relative to growth, value may not have all that much more room to outperform, and indeed may underperform if history is a guide for the future.

I do agree with their main hypothesis, which can basically be summed up with a few more bullet points.

  • Even though value has outperformed growth by 2.2% on average over the past 26 years (the history of the R1000V and R1000G), R1000V actually underperformed R1000G over the entire history as recently as 2000!
  • Yes, this was due to there being a bubble in 2000. (This may take a couple read throughs) If one were to hold constant the P/S or the P/E of the value stocks divided by the P/S or the P/E of the growth stocks over the whole time period from the indexes' inception through 2000, value would have actually outperformed growth. The reason is because this relative P/S or P/E measure contracted big time, causing much of the underperformance of value relative to growth from inception to 2000.
  • Historical P/S and P/E of value relative to growth implies value is 1.7 and 1 standard deviation expensive relative to growth. This doesn't bode terribly well for value relative to growth. The next bullet goes into some numbers.
  • If one were to take all value over all years and bucket them by P/S and P/E, one could compare the returns over the following year for those stocks net of the return earned on growth stocks over that same year. If one were to do so, one would get a graph as per the one below:


What this says, for example, is that as one goes from the lowest decile of valuation (the lowest P/E or P/S bucket) to the highest, the outperformance of value relative to growth decreases. In the 10th bucket, the outperformance disappears when valuation is measured by P/E and goes negative by P/S! So they say this bodes poorly. And indeed, intuitively it does.

Comments:

Honestly I don't have all that many beyond the inconsistencies and the journalistic concerns mentioned above. The only additional point I might add is that R1000V and R1000G are large cap indices. I would be interested to see how a more total market index plays out, as well as the numbers for small cap portfolios.

Do I believe the value premium has vanished? Nah. But some additional points do merit making.

As GMO mentioned, growth is more volatile and has a higher beta than value. If we have another tech bubble in 2006 (haha yeah right) and all stocks happen to go up like crazy, ah well. Value will underperform but there will be returns to be had. Small loss on an absolute basis. However if the market tanks or treads water, do I want to be in growth relative to value? While I don't have the numbers in front of me, my gut says that value tends to outperform relative to growth in bear markets because value is arguably less susceptible to multiple contraction. This would imply that from a defensive standpoint in this scenario, value would outperform.

Maybe I am fooling myself, but I tend to prefer the risk-reward characteristics of a value-biased portfolio. There are psychological tricks I think we investors are subject to when looking at relative studies.

Relative studies have a difficult time judging absolute performance.

Sunday, September 18, 2005

How Did Social Networks Become So Popular So Fast? Some Thoughts.

One of the things I (along with numerous others I'm sure) have been paying attention to is the white hot popularity of social networking sites these days. I am no expert and there are other sites like Minority Rapport, written by my good friends Doug Sherrets and Jon Turow, which have done an excellent job of tracking their growth and evolution, I thought I'd share some thoughts on why I think things have evolved in the direction they have. To put it simply, we have been bombarded by technologies which have allowed us to communicate increasingly easily with one another. It's only natural that our attention has turned to studying the dynamics of social networks and the rise of well constructed social networking websites. Society needs a structured way to leverage its newfound ability to communicate, and social networking websites offer us this leverage. In this context, it will be interesting to see how social networking continues to evolve. I offer some thoughts at the end.

Below I expand on this idea with a network analysis twist.

In the not so distant past, the primary means through which a person could connect with someone else was face-to-face conversation. This had a marked impact on the dynamic of a person’s social network—it was highly dependent on ones physical location. Because the typical person back then was also highly constrained in his or her ability to move from place to place, we had little ability to surmount geographic constraints. The social benefit to understanding social network dynamics was small because social networks were, simply put, not dynamic. Contrasting how things were with how things are leads to an important conclusion. The social benefit to understanding social network dynamics is heavily dependent on our ability to communicate with one another, and as a result, has been heavily driven by technological change.

The advent of the phone technology eliminated the need to be within a stone’s throw of someone to communicate with them, increasing our ability to communicate. We could connect with important people we hadn’t even seen before as long as we knew their phone number (perhaps through someone in our social network!). The advent of transportation technology markedly increased our ability to communicate because of its ability to increase our geographic range of motion. The advent of email technology allows people to structure their thoughts in the form of a letter and send it to someone across the globe within seconds. The advent of instant messaging technology goes one step further, allowing people to have multiple interactive conversations with each other simultaneously. Because we have been bombarded by technologies allowing us to communicate increasingly easily with others, it is only natural that our attention has turned to studying the dynamics of social networks. Society needs a structured way to leverage its newfound ability to communicate.

However, looking at individual technologies in isolation misses the lion’s share of how technological advance has aided communication which in turn has driven the importance of social networks. As Watts stated in “The Connected Age,” there is only so much which can be learned about the dynamics of a network from a study of the individual component pieces—one needs to think about the network dynamics as a whole. The same concept applies to how technology has driven the growth of communication. While it is true, for example, that cars increased our geographic range of motion, the coupling of cars with cells phones allows us to remain in touch with the people we meet in far-away areas when we return home. The same can be said of social networking websites. Users are far more interested in social networking sites because cars, cell phones, email and instant messaging services make it all the more easy for users to contact and communicate with the people they see on a website like facebook. The evolution of all these technologies in conjunction with one another has driven communication and the study of network dynamics far more than the component technologies could possibly explain in isolation from one another.

What impact does all of this have on corporations? I think it makes a hell of a difference! Communication flow is something which can be monitored, and can lead to quantum leaps in corporate efficiency, IMHO. While individuals may have privacy concerns (and rightly so), there is a goldmine of information which can quite easily be made available to corporations who so desire to scrape it up.
  • IT crises are exacerbated by communication bottlenecks, so wouldn't it be helpful to know where those bottlenecks are most likely to occur, probabilistically speaking, by analyzing the network flow of emails to and from the IT department?
  • Stress testing with the proper communication monitors in place could allow corporations to simulate such crises, track the communication flow in real-time and improve corporate communication flow with a solid post mortem analysis of that communication flow.
  • Corporations could identify the communication gaps which may exist between it and other corporations. Knowledge of such gaps could be indicative of future problems or of potential vulnerability, and could be a stimulus for value-added change.
  • The list goes on and on. These are all changes that are most definitely possible now given the current state of technology. While no one may act on this technology as much as they could, it wouldn't surprise me at all if we were to see more of a concerted move in this direction at the expense of personal privacy.

Social networks contain a wealth of valuable information. The scary part is that we must lay ourselves bare to unlock the value. Given how competitive the business world is right now, I am not too optimistic about the implications on privacy-- but hey, at least our economy may run more smoothly.

Wednesday, September 07, 2005

WisdomTree Investments: September 9th 2005 Update

I will get back to Lo's paper soon, but I just thought I would update my prior post on IXDP, Index Development Partners, WisdomTree Investments or whatever else you want to call it.

Today, they announced the hiring of Richard Morris as the Deputy General Counsel (article here). This new addition interests me, because he seems to fill part of the hole I mentioned in my prior post; that is, regulatory issues and concerns. Morris was senior counsel at Barclays as Barclays went out to launch its very first iShare, which has since become the 800 lb. gorilla in the ETF market. His experience at the SEC further reinforces the unique regulatory skill-set he can bring to the table at IXDP. Putting it all together, their management team is now as follows:

  1. CEO: Jonathan Steinberg

  2. Chairman: Michael Steinhardt

  3. Director of Fund Services: Michael Jackson

  4. CFO: Mark Ruskin

  5. ETF Distribution: Ray DeAngelo

  6. Senior Investment Strategy Advisor: Jeremy Siegel

  7. Senior Analyst: Jeremy Schwartz

  8. Deputy General Counsel: Richard Morris

  9. Board of Directors: Jeremy Siegel, Frank Salerno, James Robinson IV, Michael Steinhardt, Jonathan Steinberg
Looked at another way, they now have 7 senior managers. Two deal primarily with general operations (Steinberg and Ruskin). One deals primarily with more ETF-specific operations (Jackson). Two are solely geared towards the research and development of innovative indexes (Siegel and Schwartz). One will deal primarily with the legal and regulatory issues associated with ETF sponsorship (Morris). One is geared primarily towards marketing newly sponsored ETF’s to various clients and platforms—brokerages, retirement platforms, individual investors, hedge funds, mutual funds (DeAngelo). Thus, the management team seems to flow from the index creation process all the way to the marketing of funds to a wide array of investors.
Key take-aways to me at this point:

  1. Regulatory concerns seem less of a constraint to me than they did pre-Morris.
-However I am still confused as to how they can go about expediting the sponsorship process.

  1. IXDP’s management team has far more depth and breadth than that of PowerShares, which may allow for more explosive growth post-sponsorship than PS could ever dream about.
-PS now has around $500M AUM, 4 partners and around 8 employees. It has 4 ETF’s and 24 awaiting approval (article here).
-Its head portfolio manager doesn’t have quite the same reputation as Jeremy Siegel.
-PS’s distribution and marketing capabilities seem relatively constrained.

  1. My initial estimates for cost were no good; way too low.
-My gut is saying that they’ll need a lot more than $4M in steady state to run the operation they’re looking to run. The size and stature of the management team implies very ambitious plans.

  1. The kicker, it seems, is whether or not enhanced indices will attain proof of concept. And can IXDP pay the education costs necessary to spread the word, as BGI has (and PS currently isn’t)?
-I am not yet sure PS has proven that enhanced indices ‘works’; will these indices really outperform over the longer term?
-PS doesn’t have the infrastructure to do the marketing necessary to educate consumers properly. I don’t expect IXDP to get any real substantial spillover education benefits from PS.
-BGI, as a case in point, has spent large amounts of money marketing its products—seminars, white papers, advertisements, and more (article here). This is in addition to large sums of money they’ve spent to construct and rebalance the $115B AUM in the 99 ETF’s that currently trade under the BGI name. BGI itself has around 2,000 employees.

  1. The future for IXDP still seems bi-modal to me.
-Cost structure getting large, will have to get larger.
-High education costs with little help at this point (unless they or their indices are bought out).

I haven’t had the time to do proper due diligence on just how costly this will be, but one might want to take a step back and think about just how many of the first movers marketing truly new products were the eventual beasts in the space they were moving to occupy. BGI had marked advantages, most notably a large base of capital which it could fall back on to pursue a longer term goal. Will IXDP, through Steinhardt and other financiers, be able to secure enough financing to do the same as an upstart with no parent?

When Andy Lo Says There are Large Systemic Risks in the Hedge Fund Space, It Might Be Time to Start Worrying-- Introduction

When Andy Lo Says There are Large Systemic Risks in the Hedge Fund Space, It Might Be Time to Start Worrying

Background on Andy Lo
Let me preface by saying that Andy Lo is one of the smartest people in the financial world, IMHO. A financial engineering professor at MIT, he has written numerous papers and books on computational finance and financial engineering. He and Wharton Professor MacKinlay co-wrote the famous paper a while back on the notoriously high serial autocorrelation of the market (back when that was actually a tradable phenomena, prior to the autocorrelation’s subsequent demise in absolute terms). He’s currently at the helm of a $400M hedge fund, AlphaSimplex. And of course, he’s received numerous awards.

Summary of Andy Lo’s Paper
Anyways, he wrote an interesting paper back in August (you can read it here) regarding the risk/reward profile of hedge funds, on average, relative to traditional investments and the implications of that profile on systemic risk in the financial markets.

Specifically he creates metrics to track liquidity risk and the importance of leverage. These are obviously highly tied to systemic risk—should a highly levered investment vehicle experience a sharp loss and the bank loaning the vehicle funds decides to retract some of that credit, the vehicle will be forced to liquidate positions he may not want to liquidate leading to some major market impact. And all else equal, the less liquid the assets being invested in, the more market impact there will be. That it is the essence of what happened to LTCM back in ’98. Sharp losses, credit retraction, forced selling, market instability.

So if hedge funds happen to be more highly levered and are investing in less liquid investments, all else equal, we may want to start worrying that the probability of an LTCM-type blowup will go up. So do hedge fund returns correlate on the downside? For the more sophisticated readers, you may want to skip the sections with heading “Basic Fact”—they don’t really bring much new to the table.

Basic Fact #1: Current Dynamic Risk Measurement is Lacking
The first thing that Lo establishes is the inadequacy of many of the more common risk metrics, especially when they are evaluating active trading strategies. He poses the question—imagine someone were to come to you with a hedge fund that has an average monthly return 2.6x that of the S&P while “risk” as measured by standard deviation is only 1.6x that of the S&P, with 6x less down months and twice the sharpe ratio of S&P and only 60% correlation to the S&P over a 7 year period (1992 to 1999), would you seriously consider investing in that fund? Well, a simple strategy that happens to match that payoff profile is, simply, selling puts on the S&P according to a simple rule. And while no fund would actually go about doing exactly that, there are very creative ways they can do exactly that so that no one knows what the hell they’re doing.

Obviously Lo is hitting on small sample bias in the presence of trading strategies with high skew and kurtosis (tail risk; a strategy that typically has many small positive payoffs and a few really big negative ones). Taleb has been preaching this for years.

Basic Fact #2: Downside Correlation Can Cause Market Neutral Hedge Fund Return Correlation to Go from 1% 99.9% of the Time to 99% .1% of the Time.
Lo calls it phase locking risk and explains it very simply and elegantly by taking into consideration two hypothetically market neutral hedge funds. I’m too lazy to write out the math but the key takeaways are as follows.
  1. During times of market stress, market neutral funds which ordinarily have arbitrarily low correlations to one another can experience arbitrarily high correlations.

  2. Small sample bias again discourages proper estimation of the “true” statistical properties of the moving parts involved.

  3. In fact, the inherent non-stationarity of real-world processes can completely preclude proper estimation of conditional downside volatility and probability (this is just my opinion).

  4. In any case, more sophisticated risk metrics are needed in the face of basic fact #2, which must be able to measure the non-linear impact of having, say, heavy credit or sector exposure. Or how about capturing the systemic risk of investing in an emerging markets fund and a fixed income fund relative to investing in 2 market neutral fixed income funds.

Non-Basic Fact #1: The Dynamics of Hedge Funds Do Indeed Differ from Traditional Investments
A huge number of studies have been done and have come to the following tentative conclusions:
  1. Hedge fund returns have abnormally high positive serial autocorrelation.

  2. “Market neutral” hedge funds may not be all that market neutral when one moves away from ‘beta’ towards a perhaps more applicable measure of market risk.

  3. Hedge fund performance is indeed inversely proportional to size.

  4. Operational risk (fraud in particular) is the primary cause of hedge fund blow-ups.
The list goes on. The point is that one doesn’t typically see these sorts of characteristics in traditional investments.

Statistical Analysis of Hedge Fund Returns Databases:
Lo then goes into some truly very interesting hedge fund returns EDA (exploratory data analysis). Below are some of the truly cool statistical facts from within the CSFB/Tremont Indexes:
  1. Historical average returns vary widely between strategies, with dedicated short sellers on one end of the spectrum at -0.69% and global macro at the other end with 13.85% (the latter fact surprised me greatly!).

  2. Historical correlations with S&P also vary widely between strategies, with Long/Short Equity funds on one end at 57.2% (this seems dangerously high) and dedicated short sellers at the other at -75.6%.

  3. Rolling correlation is on the rise for multi-strategy HF’s and fund of funds, which makes sense—as assets under management goes up, it becomes increasingly hard to not be like the market!

On to the main event—can we measure ‘hidden’ exposures like downside correlation risk, fat tail risk and illiquidity risk? The summary and my thoughts on his results and their implications to come soon.

Saturday, September 03, 2005

Thoughts on the Nature of Good Analysis

Sorry for the lack of posts; I've been a little busy. I've been doing a lot of thinking about the nature of good analysis, and the pros and cons of being systematic relative to a more unstructured analysis. I've reached a few tentative conclusions.

  • As I've said before, I believe the rational paradigm is to be systematic when it's applicable to be systematic. Emphasis on applicability. Just because I have a certain skillset doesn't mean that that skillset will actually be useful in all contexts! That is most definitely true with value investing.
  • As Charlie Munger famously said, it really helps to have a lattice to structure the information that you take in. The information "sticks" better as a result and it opens the door wide open to levels of analysis that are inconceivable under another approach. For example, lets say you're looking at some company's balance sheet and you see that they have x square feet in land on their books. How do you process that data point? Well, it'd probably be more useful to consider that in the "breakup value" paradigm and not really a DCF standpoint. Or when I'm looking at stock prices, what information is there to be gained from that? Maybe it might be helpful to see how correlated your stock is to other stocks and to the overall market. The whole point is that it really does help to have those paradigms-- that latticework-- in your head so that you can turn that data into real usable information. It's very helpful to build the proper paradigms for thought.
  • There are indeed benefits to wading through information in an unstructured way. Even if at this point in time, we have a pretty good general idea of how we should be processing information, things change. What was important yesterday may not be quite as important today. Or entirely new paradigms may form. All this implies that it might be a good idea to always keep an ear to the ground and scour through bucketloads of information that may or may not be all that helpful, just to make sure that you haven't overlooked something which may be of the utmost importance.

IMHO, thinking about how exactly we should be processing data is extremely useful. Have you ever had that feeling after reading every article in a magazine or newspaper that it all simply went in one ear and out the other, and none of the information really stuck? I sure have. Useful paradigms are the solution.