Commentary On The Trouble With Value
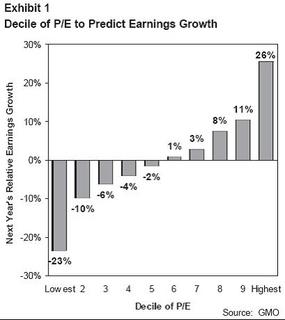
Fact #1: The Market Has it Mostly Right-- P/E Ratio is, in fact, one of the best indicators of relative 1 year forward earnings.
-The graph below sums this one up nicely. What it says, for example, is that when the P/E ratio was in the bottom 10% of its history, earnings growth is 23% below average, and conversely when the P/E ratio was in the top 10% of its history, earnings growth was 26% above the mean. I assume they either took the P/E ratio of the market with annual sampling over its history, or they took all companies available at all years, and annually sampled their P/E ratios. The latter might be subject to survivorship bias conditional on the integrity of the dataset.
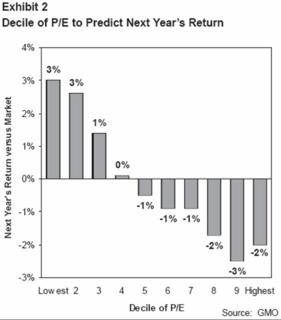
 Fact #2: Value Stocks have indeed outperformed the market historically
The graph below makes this clear. What it doesn't show, though, is how volatile this outperformance has been, which is where things start to get interesting. For those who are looking at this for the first time, what it says, for example, is that if all stocks over all years were thrown into buckets ordered by their P/E ratios, and one were to calculate next year's return relative to the market return that year, the highest bucket underperformed the market on average by 2%, while the lowest bucket outperformed the market by 3%.
 So what GMO did to dig into this a little more was compare the Russell 1000 Growth index versus the Russell 1000 Value index. The author assumes this to be a good proxy for value versus growth, so perhaps one might want to know exactly what the difference is between the two:
Russell 1000® Growth Index: Measures the performance of those Russell 1000 companies with higher price-to-book ratios and higher forecasted growth values. Is constructred to provide an unbiased barometer of the large-cap growth market.
Russell 1000® Value Index: Measures the performance of those Russell 1000 companies with lower price-to-book ratios and lower forecasted growth values.
I would give Russell the benefit of the doubt on this one, but it should be noted that its index doesn't appear to be constructed perfectly on the basis of Price to Book, and perhaps only loosely based on Price to Earnings or Sales.
GMO's piece then delves entirely into statistics on P/S and P/B, with P/S, the metric providing the most "trouble with value" but in some sense the least valid at least relative to P/E, explained first.
This begs a question and a hypothesis.
- If the comparison of R1000V versus R1000G is our proxy for value versus growth and both are primarily based on P/B, why would GMO adjust valuations using P/S and P/E? To be totally consistent, if they are going to adjust by P/S, they should construct an alternative index which splits out stocks into 2 buckets based on P/S. Same goes for P/E and P/B. To do otherwise is inconsistent, even though the results may very well be similar!
- It seems to me that the P/S example was put forth first because it elicited the most "trouble with value." It should be noted that Rob Arnott, in his construction of a more "pure" S&P index in that really really awesome paper he wrote a while back, P/S simply wasn't as good a representative index than P/E or P/Cash Flow, if I remember correctly. So this coupled with the lack of consistency mentioned in (1) lead me to wonder whether things are necessarily as bad as they appear for value.
Fact #3: Given the recent major outperformance of value relative to growth, value may not have all that much more room to outperform, and indeed may underperform if history is a guide for the future.
I do agree with their main hypothesis, which can basically be summed up with a few more bullet points.
- Even though value has outperformed growth by 2.2% on average over the past 26 years (the history of the R1000V and R1000G), R1000V actually underperformed R1000G over the entire history as recently as 2000!
- Yes, this was due to there being a bubble in 2000. (This may take a couple read throughs) If one were to hold constant the P/S or the P/E of the value stocks divided by the P/S or the P/E of the growth stocks over the whole time period from the indexes' inception through 2000, value would have actually outperformed growth. The reason is because this relative P/S or P/E measure contracted big time, causing much of the underperformance of value relative to growth from inception to 2000.
- Historical P/S and P/E of value relative to growth implies value is 1.7 and 1 standard deviation expensive relative to growth. This doesn't bode terribly well for value relative to growth. The next bullet goes into some numbers.
- If one were to take all value over all years and bucket them by P/S and P/E, one could compare the returns over the following year for those stocks net of the return earned on growth stocks over that same year. If one were to do so, one would get a graph as per the one below:
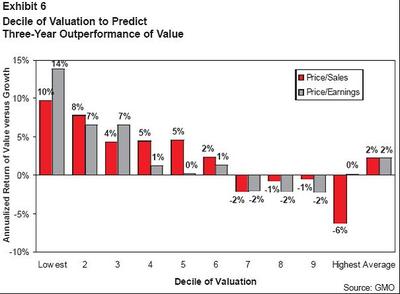
What this says, for example, is that as one goes from the lowest decile of valuation (the lowest P/E or P/S bucket) to the highest, the outperformance of value relative to growth decreases. In the 10th bucket, the outperformance disappears when valuation is measured by P/E and goes negative by P/S! So they say this bodes poorly. And indeed, intuitively it does.
Comments:
Honestly I don't have all that many beyond the inconsistencies and the journalistic concerns mentioned above. The only additional point I might add is that R1000V and R1000G are large cap indices. I would be interested to see how a more total market index plays out, as well as the numbers for small cap portfolios.
Do I believe the value premium has vanished? Nah. But some additional points do merit making.
As GMO mentioned, growth is more volatile and has a higher beta than value. If we have another tech bubble in 2006 (haha yeah right) and all stocks happen to go up like crazy, ah well. Value will underperform but there will be returns to be had. Small loss on an absolute basis. However if the market tanks or treads water, do I want to be in growth relative to value? While I don't have the numbers in front of me, my gut says that value tends to outperform relative to growth in bear markets because value is arguably less susceptible to multiple contraction. This would imply that from a defensive standpoint in this scenario, value would outperform.
Maybe I am fooling myself, but I tend to prefer the risk-reward characteristics of a value-biased portfolio. There are psychological tricks I think we investors are subject to when looking at relative studies.
Relative studies have a difficult time judging absolute performance.
posted by Dan McCarthy at
9:53 PM
![]()
![]()

1 Comments:
This comment has been removed by a blog administrator.
By Anonymous, at 10:56 PM
Post a Comment
<< Home