The Art of Streetplay

Friday, August 26, 2005

On the Nature of Outliers: Quant Vs. Fundie Analysis

I've been thinking a lot about the implications of one of my prior posts, "Useful Applications for Quantitative Ability with Fundamental Analysis." I think there are a few things worth mentioning about the nature of residuals versus outliers, and how that plays into this whole schema I've written about god knows how many times.

The bottom line:
  • Quants may toss outliers to denoise their data so that they can properly estimate the "true" relationship between two variables. Once they have established the "truth," they can simply trade the noise. That is the game of tons of prop trading shops, and it does make some sense. I have done it myself while at a big bank. And we traded a ton of bonds.
  • Fundamental analysts ('FA's') actively seek those same outliers which were thrown out. Rather than trade continuously, they sit on their hands in waiting most of the time. And when those outliers surface themselves, the FA's put on their positions in size. This also makes sense.
Those simple facts have huge implications on the applicability of quantitative methods in a qualitative setting!

Sure, I could de-noise my time series prior to calculating rolling correlations of every stock on every other stock, and sure I could calculate the correlations of the wavelet spectra, but while that may be more technically precise, it first of all dramatically increases the computational time. But even assuming computational time wasn't an issue, it's not really hitting at the point.

Traditional correlation and the correlation of wavelet spectra are not orthogonal concepts. They are generally jabbing in the same direction. If that is true, then turn to what the goal of analytics are in a deep value setting, and what deep value investors are attempting to do. They are attempting to find situations which are completely out of the ordinary, and are content on sitting on their hands until they are able to find such a situation.

If I am looking for a situation that is truly out of the ordinary, then statistics and hardcore mathematics will not help me 99% of the time, because we aren't trading noise, we are trading outliers. Whatever intuitive concept I am trying to pick up with statistics would have to be so extraordinary that at that point, any statistic generally pointing in a similar direction should be flashing red lights!

I know that a lot of times, a good investment comes as a result of many small oddities lumped on top of eachother. In this sort of situation it does help to have the additional precision. But the driving notion is to keep in mind the nature of the diminishing returns due to precision in a value framework.

Thursday, August 25, 2005

Taking a Look at Index Development Partners

Taking a Look at Index Development Partners (IXDP.PK)
Below I take a look at IXDP and how it fits in the ETF industry. I conclude that while it’s not a deep value investment, it at the least is an interesting stock. At its current valuation though this is kinda ridiculous, unless they do something non-ETF related. I start with a write-up I did back in April 2005 on the ETF industry in general with a focus on equity ETF’s and IXDP in particular. At the bottom I update the situation briefly.
Size:
Total ETF assets accounted for $226.21 billion at the end of 2004, a 49.8% increase over the level of the previous year, according to the ICI.
Growth Prospects:
Some industry experts said it will be hard for ETFs to keep up that kind of growth without new products. Unfortunately, most equity indexes are taken, which means that it will be difficult for ETF providers to come out with new domestic-equity funds. But new products will come. The difference is, some will probably have an actively managed flavor. The first steps towards actively managed ETFs are going to be enhanced indexing, which is where Index Development Partners (IXDP.PK) enters the picture.
Comparable:
PowerShares Capital Management is one company which constructs enhanced indexes. It currently has seven new enhanced indexes based on Intellidex, a quantitative methodology, and now has around $500M in assets (PowerShares is planning to release a few new ETFs over the summer, some of which are based on Intellidex and some of which are going to be more ‘traditional’ they say). Rydex is involved with more passive strategies as well, but it has some pseudo-active strategies too. Its RSP S&P Equal Weight Index (rebalancing periodically) currently has ~$760M in assets.
Avenues for Growth:
Industry analysts, however, stressed that while steady streams of new products are expected, they aren't necessary for the industry's assets to increase. While ETFs grew tremendously last year, total assets are small compared with the more than $8 trillion in mutual funds. If one holds the supply of wealth fixed, this means one big potential source of asset growth comes from taking sales away from the mutual fund industry.
The key to capturing more assets is education. Another potential key is the inclusion of ETFs on retirement platforms. Thus, growth is as much an exercise in marketing and business strategy as it is one in quantitative finance. Michael Steinhardt has specifically stated his interest in targeting all the important constituencies—brokerages, retirement platforms, individual investors, hedge funds, everyone.
My Spin:
Investment strategies can be broken down into three broad categories—passive, pseudo-active, and active. The passive category has been largely exhausted. BGI was the victor in this field with its portfolio of iShares. There may still be some room for growth in passive bond and international strategies, but passive domestic equities are pretty much entirely covered. Active strategies are more the domain of hedge funds, which allow for complete investment flexibility, or other investment vehicles. Active strategies would be a difficult market to enter because it is highly competitive.
However the same isn’t necessarily true for pseudo-active strategies. What puts them in a unique competitive position is two-fold:

  1. They are active enough to “fine tune” passive index investment, potentially augmenting the risk-return characteristics of the investment with simple generally quantitative rules.

  2. They are passive enough to avoid the often onerous expenses charged by hedge fund and mutual fund managers alike.
There are currently two big players in the pseudo-active ETF market segment—PowerShares and Rydex (only some of Rydex’s portfolios however). While it is true that Barclays, Vanguard, and State Street hold the lion’s share of assets in the ETF market overall, pseudo-active strategies are fundamentally of a different type than the sort of ETFs currently being offered.
The Business Model:
So this is the bottom line for ETF success as a business, as far as I can see it. Their main goal is to get huge amounts of investment in their funds so that they can collect the expense fee. ETF companies usually have a wide array of funds, which leads me to wonder what the costs/requirements are to registering an ETF. Whatever the requirements are, by casting out a wide net of distinct ETF’s, the ETF companies can get many disparate investment groups to invest in their products who wouldn’t have done so otherwise. The shotgun approach is probably a solid way to grow assets in the long run.
Cases in point:

  • Macro hedge funds and quant funds are heavy players of SPX and other passive index ETF’s, for obvious reasons. Liquidity is already huge so ETF’s are in some ways able to capture the oft cited “hedge fund wave.”

  • Hedge funds and individual investors can make sector specific bets with iShares, so BGI has created a ton of sector specific iShares.

  • Individual investors wanting broad exposure to the markets without (1) getting charged like crazy for investing in many disparate stocks, and (2) needing to do DD on what stocks lead to the most “representative” mix to get proper diversified exposure.

  • Retirement planners can just tuck money away in ETF’s instead of more expensive mutual funds, or more risky actively managed investments.
Expense Ratio Case Study—Rydex:
Rydex generates revenues daily from its expense fee. As an example, take the Rydex equal-weighted S&P tracker (RSP). It has $765M under management and charges 40bps in the following way—Monday through Thursday count as 1 day, and Friday counts as 3. So they get .4%/365 of total assets on Monday through Thursday, and 1.2%/365 on Friday. So that fund generates around $3M in revenues annually, spread evenly throughout the year. Not much, but first of all, Rydex has $10B under management. Also, just imagine Barclays with its $110+B in assets, charging more than normal (the majority charge around 70bps), pulling in a steady $770M. Granted, they probably need to spend a good amount on transaction costs, but for crying out loud, they are doing passive indexing, and SPY is able to charge a meager 11bps! I would be surprised if they are paying more than 15bps, because even the SPY is generating a profit. This would mean that with the bulk of Barclay’s iShares, they are probably making around 55bps, implying pre-tax profits on the order of $605M.
There is one other cost which should be mentioned, licensing fees. When a company launches an ETF tracking a particular index, say the S&P, the ETF company will have to enter into a licensing agreement with S&P. This cost will probably be in terms of basis points. Vanguard ran into problems because of this back in 2001, as it was first launching its VIPER ETFs, which were referenced off of the S&P500. They believed that their existing agreements with S&P were enough, and further licensing agreements weren’t needed. S&P disagreed. Having a cheap expense ratio was of crucial importance to Vanguard, which is why this point ended up being hotly contested—Vanguard didn’t want to have to mark up their expense ratio by another handful of basis points.
Now things are quite different for enhancement strategies, because their stated goal is not solely to be representative of an index, or to have a broad exposure to something or other. If all you wanted was an ETF which has broad exposure to something or other, there is probably a passive ETF trading with a cheaper expense ratio right now. The draw to enhancement strategies lies in the potential for the 100-200bp potential upside relative to the reference index, accepting the sad fact that the expense ratio will probably be higher than their passive counterparts. Before I go into potential markets, it’s probably of value to do some back of the hand valuation calculations using PowerShares, the only true enhancement-focused comparable in the market right now, as a comparable. PowerShares was founded in August 2002. It now has around $500M in assets and 11 publicly traded funds. Its 2 oldest funds are less than 2 years old. Bond hopes to have between $2B and $3B by year’s end. Similar to IXDP, PowerShares received $10M in venture capital this year. PowerShares charges a maximum expense ratio of .6% (yet again implying big profits to Barclays).
IXDP now has a market cap of $10M. Assume that it makes a 40bp spread on {expense ratio – transaction costs}, an estimated 15bps below Barclays. Taking a look at operating expenses, before they stopped filing they were incurring around $310k in costs per quarter, or $1.24M at that run rate. Those are all probably research costs. When things start getting interesting, they will also be incurring a lot more business expenses—flying from place to place, lobbying to get advertising or to get on one platform or another—so the past is not a good predictor of the future in this case. Let’s say $3M steady state operating expenses just to throw out a number. If the above assumptions are true, they will need to have $750M under management to break even. $1B under management implies $1M in pre-tax profit. $10B implies $37M in pre-tax profit. Using PowerShares as a rough guideline, if IXDP successfully releases a few strong indices, it could hit $1B in a couple of years. IXDP has some superstar backing—the star power of the likes of Steinhardt, Steinberg, and Professor Siegel will be a plus when it begins marketing.
So the big question is what constituents would want to get involved with enhancement indices. I have a fundamental belief (as a pseudo-efficient markets believer?) that mutual fund money will slowly begin turning to ETF’s, so I believe there will be money flow for good strategies in the coming few years. Beyond that, it’s probably helpful to consider money flow from the various market participants:

  • I don’t see why anyone would short an enhanced index. If people were, I would start getting worried. So this eliminates all shorts (as a funny point of comparison, PowerShares touts that it can be sold short on a down tick—great…)

  • If costs are low, if the fund still retains its ability to track the S&P or any important index, and if liquidity is high, IXDP’s indices could get a lot of long money. If the above assumptions are true, then IXDP had better get portfolios out for all major indices!

  • Steinhardt’s stated goal is 100 to 200bps over a reference index in the long run. This is too small for a long short after interest, so don’t expect anyone to put that trade on.

  • It might be difficult to convince retirement platforms to consider IXDP because of the uncertainty associated with any form of active management.
I see big upside in Professor Siegel’s and Steinhardt’s ability to convince people that IXDP’s portfolios will be able to outperform the market on a consistent basis. Then anyone who wants to go long “the market” should consider IXDP’s portfolios as an alternative to its more traditional counterparts (ie. QQQQ, SPY).

Update
Since the time of writing the prior post, a few things have changed.

  • IXDP is changing its name to WisdomTree Investments, Inc.

  • The stock is now trading at 3.95, and has just completed another round of equity financing. It now has 94M shares, implying a market cap of $371.3M. Siegel and Steinhardt were among the buyers. Steinhardt's cash infusions make me feel a little more comfortable that this thing won't go under.

  • They’ve brought on board a few more people—Ray DeAngelo as the director of ETF Distribution, Michael Jackson as the new Director of Fund Services, and Marc Ruskin as the new CFO. They seem to have some pretty solid credentials. Finally, for those who have been paying attention, Wharton grad Jeremy Schwartz appears to have gotten a promotion. He is now a senior analyst at the fund.

Putting it all together, things are quite a bit different from the way they were.

Name Change:
The fact that the company is changing its “strategic focus” from developing indices to being an asset manager interests and troubles me. Maybe it’s just me, but “asset manager” sounds quite… active. Perhaps more so than I would hope from a company whose prior investment thesis was built on the notion of creating a ‘small protected niche’ in the ETF space, creating and sponsoring innovative ETF’s. Does this imply that things are simply going so well on the index creation side that they are now focusing on higher goals without compromising the quality of their indices? From what I’ve seen and heard, this does NOT seem to be the case. But perhaps I’m reading too much into “asset manager”—perhaps they are just reinforcing the fact that ETF’s are a great asset management product for individual investors.

Market Cap:
This thing is getting huge on no earnings. With the new full-time employees, my estimate of steady state expenses is probably on the low side. On the upside, it should be noted that in the latest equity issuance, Professor Jeremy Siegel and Michael Steinhardt were investors, although just how much wasn’t disclosed. For Steinhardt of course, this is peanuts. Even if he bought all of the 5.77M issued shares, that would amount to 10% of his existing stake. Steinhardt purchased his stake out of an equity issuance of 56.25M shares at $.16 and ended up with a 65.2% interest in the company (a 2370% return in 10 months... he hasn't lost his touch!).

Re-Evaluating Costs:
Costs prior to the discontinuation of their filings was on the order of $1.2M. I had allocated around $1.8M in possible future steady state annual expenses. With the addition of 4 executives and still nothing out yet, I could very well be undershooting it, because they haven’t had to build any infrastructure yet. While I have the utmost faith in Jeremy Siegel and Jeremy Schwartz, in all likelihood I expect they’ll need to hire a few more research assistants. If they do get an ETF off the ground, something tells me they’ll also need some more operations people. I’m tempted to peg expenses at around $4M to $5M. This implies they’ll need anywhere from $1B to $1.25B to break even. If PowerShares is any indication, a successful ETF or two could put them at around $1B within the next couple of years. $2B would put them at $3M to $4M in pre-tax profits. With a market cap of $371M, I am not too pleased.

Open Variables
Star Power: One open variable in all this of course is the star power of the management team and the experience of new executives. PowerShares is a bunch of people cooped up in a room in Chicago with seemingly few connections. WisdomTree will have far fewer frictions conditional on their release of a solid product.
Registration Frictions: From what I've heard from competitors, it is no easy process to obtain sponsorship of an index, taking upwards of 2 years. There are only around 7 companies with proper registration. Even assuming that IXDP has an index right now and has already filed, this would be somewhat damning. Perhaps IXDP has a work-around, but for now this should be a further point of caution.
Tuesday, August 23, 2005

Useful Applications for Quantitative Ability with Fundamental Analysis

I just finished successfully coding up a data miner on another database and am starting to reach a few tentative conclusions on how one can go about building a more structured, more efficient, overall better value framework using a quantitative skillset in addition to a qualitative one.

Benefits of Quantification:
When you think about it, what exactly is it which quantitative operations have which their more qualitative counterparts have less of? I would sum it up with two things:
  1. Quantitative programs can be more precise (many times perhaps overly so!) than the human brain on its own.
  2. Quantitative programs can be far more systematic than the human brain on its own.
Case in point regarding (1): when I proposed a correlation-based trading strategy to one of the smartest quants I know, one of his first reactions was to replace correlation with the correlations of the wavelet spectra and eliminate the leptokurtosis which may muddy results with a shrinker of some sort. By understanding the underlying properties driving our process (or set of processes), one can leverage a technical background to be more precise.

Case in point regarding (2): see some of the below posts for some of the more boring applications of data miners. Programs allow me scale analysis up and across the entire stock market. By slicing the market in intuitively reasonable ways, one would hope to find stocks or situations which are deviant enough from what one would expect to merit diving in with fundamental analysis. As an individual investor though, I couldn't possibly with my one brain look through the whole stock market in multiple ways. Quantitative programs are what allow me to be systematic.

Using Quant in a Value Framework
I guess for right now, the conclusion I've come to is that for a deep value investor, quant can be helpful when providing econometric analytics because of its ability to be more systematic than humans can. So when I pull up a stock that I want to research, with a few clicks I will know where my stock fits in the entire universe of stocks in intuitive and useful ways on many levels (ie. how is the industry doing, where is the P/E of my stock relative to overall market and industry and how has this evolved over time, how does the size of my company stack up with others in the industry, what are similar stocks so that I can scrutinize them, how is insider buying in my industry and in my company relative to other companies in the industry, etc etc). Those are all things I can get immediately with a fine tuned program, and I can delve as deep or shallow as I want because I created the programs and am familiar with manipulating the databases. A human couldn't do that except with great effort or at the least a lot more time expended.

Pros and Cons of the Brain and of Machines; Creating Complementarity
The question then becomes how I can combine these two distinct skillsets in useful ways. I think it boils down to identifying where each can add value relative to the other.

The human brain is much more capable of identifying idiosyncrasy. One of the common problems with relying entirely on a quantitative methodology is its inability to pick up on all the idiosyncrasies which the human brain can see. And yet at the same time quant can be far more systematic than the human brain ever could. Therefore I think it makes sense to tune my brain with quantitative analytics, and tune the analytics with my brain so that I can leverage idiosyncrasy while at the same time leveraging a systematic approach. I'm not sure how much quant's precision can help in a value framework, but I think its ability to be systematic can be of great value.

Thoughts are welcome.

Monday, August 22, 2005

A Statistical Look at the Stock Market, Part 3: Profitability of Industries and the Overall Market

Having looked at the capitalization breakdown of the stock market, it might be of value to see how earnings or a cash flow proxy ties into the picture. While at this point I can offer no more than a snapshot view (constraints on using yahoo—I’m working on tying in another website with better data), there are nevertheless some interesting facts which pop out. The first question I had was “OK, so the stock market has a capitalization of $23T—how much is it spewing out in earnings?” Well, we can try to give our best guess. Due to the dirtiness of yahoo data, while I had market cap data for 6,146 stocks (I call this dataset “M”), MC and EV data for 6,082 (I call this dataset “ME”), MC, EV and Income data for 4,427 (I call this dataset “MEI”) and MC, EV, Income and EBITDA data for 3,389 (I call this dataset “MEIE”). MEIE had an aggregate market cap of $18T, so (big assumption here) I will simply make the assumption that the value metrics obtained on this smaller (but still large) set are indicative of the overall stock market, more or less. Keeping the about caveats in mind, let’s see what we’ve got.
  • On an aggregate market value of $20.6T, MEI generated $1.23T in earnings, implying a market profit margin of 6% and a market P/E of 16.7.
  • On an aggregate EV of $21.4T, MEIE generated $2.42T in EBITDA, implying a market EV/EBITDA of 8.83.

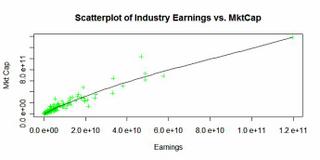
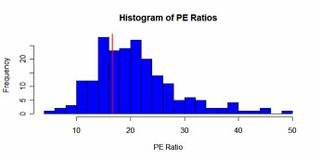
The question then becomes: which industries are contributing the most to market earnings? And how does market value correlate to industry earnings? We can look at this in terms of industry P/E ratios and graphs of total earnings vs. total price. For robustness I limit this analysis to industries with 8 or more companies because anything less and we greatly increase the chance of small sample bias.

As expected, industry market cap is a positive function of the industry earnings. Let’s dig a little deeper into the actual numbers and pull up some names to see how these companies straddle the average P/E of 16. Below is a P/E histogram.

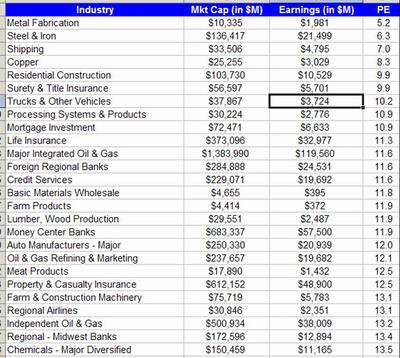
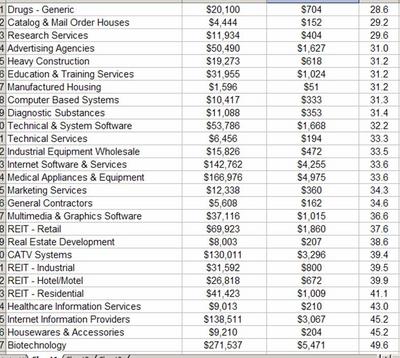
Because of issues with Blogger I am unable to post the full list of industries with their corresponding PE ratios, but below I will post some:


As expected, biotechs as an industry are very, very highly valued with an industry P/E of around 50.

Commodity-focused businesses seem cheap by P/E standards. Steel, copper, the tanker industry, oil and gas companies … all are at the bottom of the list.

REIT’s may seem on the expensive side but P/E probably isn’t the most relevant metric for that industry.
For those who are interested, I have the same information available on EV and EBITDA. Once I can incorporate how these metrics evolve over time, hopefully that’ll add another layer of depth to the analysis. And, of course, it would be interesting to see how mean reversion plays its hand. I will leave this for later.

Friday, August 19, 2005

Keeping an Eye on the Environment

If I have the ability to learn on an intimate level how one and only one industry operates, what sort of characteristics would I be looking for in that industry? For starters I've got a few ideas.

1. The total number of stocks trading in that industry; the more the better. This is because I would have the ability to make bets on a wider array of stocks; in other words, better breadth (thanks Alex). From a completely pragmatic point of view, a larger number of stocks increases my chance of finding one or two that are really really cheap witout having to move outside of my sphere of confidence.
2. The absolute correlation of the industry with the overall market; the less the better. If I have little ability to predict what the market will do going forward, do I want my investments to be driven by the market? I may know that the market generally has positive expected returns over long time horizons, but from a risk management point of view, that's a tricky argument to play. It's an unhedged risk.
3. The level of flux inherent within the industry; the more the better. Even if there were a ton of stocks in my industry, if they were all perfectly correlated with one another that wouldn't leave me with too much to work with-- arguably, the wider set of stocks would offer me little advantage in that scenario. Flux implies whatever steady state that industry will evolve into has yet to surface. This is the sort of environment in which fundamental analysis and critical thinking can be truly value added.
4. The market value of the industry; all else equal, the more the better to avoid possible capacity constraints.
5. The level of competition within the industry; the less the better. Small caps may have one fortieth the market value of large caps, the competition is also markedly lower, and reasonably so. For investors who don't have to worry as much about capacity constraints, one could make a few compelling arguments for why small caps may be a lucrative place to be.
6. The amount of insider buying within the industry; the more the better. This is a very nuanced subject which I won't go into here. I have issue with most academic studies on this topic because their academic techniques strip a lot of them of creativity and flexibility. There are a few great books written on this... but needless to say, the data is there to be inspected.

The cool thing is that literally all of the above factors can be quantified! I will attempt to lay out some actual numbers soon. God knows how helpful such an analysis would be, but it's definitely very doable, and for a stupid kid like me, it might actually prod me on to focus a little more on one particular industry in addition to the generalist individual stock stuff I've been doing up to this point.

Quantified or not, from a risk management point of view it may be of value to take a second look through your portfolio and ask yourself just what sort of environment your investments are living in... or whether you have a coherent investment paradigm in the first place.

Wednesday, August 17, 2005

A Statistical Look at the Stock Market, Part 2: Market Caps with Industry Focus

Industry Breakout:
Another interesting statistic might be just how big each industry in the market is in market cap terms. Could be helpful when considering what your capacity may be, should you focus on a particular market segment.

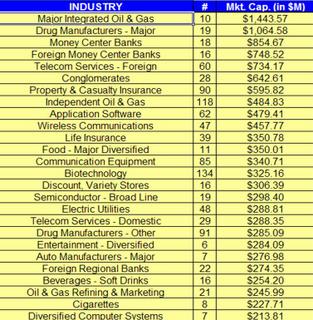
According to yahoo finance, there are approximately 221 industries. Obviously it's then impossible to really list them all out-- but what we can do is take some of the most populous industries as well as some other notable ones to try and draw some conclusions. Below are a few interesting facts (chart of the 26 biggest industries below):

  • Believe it or not, it appears that there are more regional banks and S&L's than there are stocks in any other industry. There were 220 S&L's in the set, 146 banks in the northeast region, 139 banks in the mid-atlantic region, 101 banks in the pacific region and 95 banks in the mid-west region. The only other industries which are in the top 10 were 'business software and services' (#3), 'business services' (#5), biotech (#6), independent oil and gas (#7), and 'scientific and technical instruments' (#8).
  • That being said, regional banks and S&L's are by no means the largest industries. The market size for S&L's in aggregate is $134.6B. Banks in the northeast were even smaller at $81.8B.
  • Perhaps as expected, the largest industry in terms of market cap is Major Integrated Oil & Gas at $1.4T, or 7.2% of our economy. The funny thing is that there are only 10 stocks in the industry (of course, the 10 include XOM, BP, and RD).
  • Given all the talk of real estate bubbles, why not take a look at the REIT's as an industry in terms of size and composition. From what I can see, there are 157 REIT's thrown into 7 categories-- Diversified, Healthcare, Hotel/Motel, Industrial, Office, Residential and Retail-- with a sum total market value of $302B split. This, by the way, is almost in perfect agreement with Barron's own estimate of the market size of the REIT industry of $300B. While $300B may not sound terribly bad, one must also remember that market cap understates the industry's economic size, which is probably better estimated by enterprise value. In EV terms the REIT market is $600B, twice as large.
  • Looking at the numbers though, I am not so sure Barron's argument that REIT's have been so bought up that dividend yields aren't compensating enough for their riskiness-- the numbers that I have indicate the average dividend yield is 6.25%, not their quoted 4.5%. For all you yield hogs, check out RPI, CUZ, SAX and AZL. What kind of a whacked up stock has a dividend yield over 50%??

This is all a very low-level analysis, but at least to me it's underscored how important it is to question assumptions and double-check numbers. The information is there, whether it's individual stock data, industry data, economic data, or what have you. As long as you're facile enough with data manipulation to tinker around and do the proper tests (which doesn't take any rocket scientry), I think it's possible to get a much deeper understanding of the nature of the relationship between a set of processes you happen to be looking at. Overlay on top of that some solid individual stock analysis and your analysis could be all the more thorough.

The question then becomes... are there any quantitative ways one could go about identifying an industry in a state of flux, and are there any properties I would hope to see in the industries and/or individual stocks I invest in? That's the topic of another posting.

A Statistical Look at the Stock Market, Part 1: Market Cap

Having finally had some time to sit down and play around, I've created a few neat functions in an attempt to get a better picture of the composition of the stock market, and hopefully pick up a few neat facts. This is the first of what will be a series of entries, winding around from market cap facts to beta information, to industry statistics, to aggregate value metrics, to aggregate correlation analysis before (hopefully) joining it all with a look at insider trading.

Rather than rely on second-hand information, I decided to dig into yahoo Finance. It's possible to create a function which systematically extracts all the ticker symbols on the yahoo Finance page by going to the screener, setting a non-constraint, and creating a program which cycles through the resulting output and picks up on the location of unique tickers in the HTML from the source page. Out of a stated total number of tickers of 6930, I was able to pull 5958; far from everything, but a respectable fraction.

One can then create another program which takes a user-specified list of tickers and digs into the 'key statistics' and 'industry' tabs on yahoo Finance, pulling out the columns of interest from both for all tickers, spitting the output into a matrix. For starters I pulled market cap, industry, ttm P/E, fwd P/E, Price/Book, EV/EBITDA, Dividend Yield, Beta, and Industry.

I'm going to go back in for a second round, but here are some facts which I picked up.

Market Cap:
Size:
The aggregate market cap of my 'market' was $22.1 trillion. The stated market cap of the NYSE is $20 trillion, indicating to me that this index, while imperfect, is indeed fairly robust.

  • Capitalization Breakout:
    Now let's say you're a big fund manager with a huge line to throw around, and as a result you can invest in nothing but large cap stocks ($1B+ MC). What is your universe? How about mid cap investors? Small cap?

    -According to this data, there are 1852 large caps, 698 mid caps, and 3344 small caps. In other words, there are nearly twice as many small caps as there are large caps. The benefit to sticking with large caps is really obvious from the data though. The large cap space has $21.1T in market cap terms. The mid cap and small cap spaces have $509B and $488B, respectively. In other words, relative to a small cap investor, the large cap investor has half as many stocks but 40 times as much potential total equity to invest in. I was actually surprised that the small cap space wasn't more disperse-- however it should be kept in mind that the total number of small caps is highly likely to be biased downwards, because many small caps don't have legitimate key statistics data and the truly small stocks (with prices less than a buck) were kicked out.

Comparison to Hedge Funds and Mutual Funds:
To put this in perspective, we can look at the emergent hedge fund and mutual fund industries.

  • While $1T seems to be the most popular estimate of hedge fund assets under management, John Mauldin actually estimates it to be closer to $2T (original study done by Strategic Financial Solutions). They arrived at that estimate by analyzing 12 hedge fund databases, removing duplicates and clones, and differentiating between fund of funds and single manager funds. According to them, the ~4000 single manager funds accounted for the lions share of assets under manager at $1.5T, with a mere 175 or so past the $1B mark. In total, they estimated ~7,700 hedge funds and CTA's (commodity trading advisors).
  • The mutual fund space is much, much larger, with almost 8000 US-based mutual funds and $8T under management. Worldwide, the mutual fund industry is much larger, at an estimated $15T.

The numbers speak for themselves-- it's somewhat staggering that worldwide, there is an estmated $17T in assets under management, 85% of the NYSE in market cap terms and 77% of my total market estimate, but a few points merit making:

It goes without saying, but these hedge funds and mutual funds are not only investing in equity, but also in debt, the world market value of which is larger than the equity markets. The market value of worldwide equity in dollar terms has been estimated to be $36T. That of the bond market is $49T, 36% larger. The sum total of these two is $85T, which implies that mutual fund and hedge fund assets are a less alarming 20% of total worldwide debt and equity markets.

It might be of value to take a look at the actual distribution. I plot a histogram of it below:

(Sorry for the lack of clarity). The left blue line is the median market cap, at $337M (small!). The right blue line is the average total market cap of $3.75B, indicating a huge amount of skew from some of the bigger stocks in the index. As expected, Exxon Mobil is the largest stock in the market. The smallest stock goes by the name of LFG International Inc., with a market cap of a whopping $5k. I wonder why it even bothers to be a publicly traded company, considering the fact that their capital structure is apparently almost entirely financed with debt (its enterprise value is $1M).

The key take-away for me from this is that I should make sure to be more specific when I say that I'm in a crowded space or not. There may be a lot of money in hedge funds, but to then reach the conclusion from this fact that the market has suddenly become really really efficient as a result might be a stretch. I may want to pay attention to the breakout of hedge fund assets deployed in the various market classes.

The fact that small caps as an asset class are 40 times smaller than large caps is a double edged sword in my point of view. It is definitely true that a lot of people can't play there because it truly is a small asset class. That being said, its small size may prove to be a liability should hedge funds, hungry for new places to go and new asset classes to trade, decide that small caps might provide a decent return on their time. There isn't all that much to go around.

Monday, August 15, 2005

Mining the Web for Indicative Data

I've spent the past day learning how to mine Yahoo Finance for its data, and I gotta hand it to Yahoo-- its website is quite mine-able. R has been my weapon of choice up to this point. The question has been the following: is there some way to leverage the huge databases stored on the web, explicitly (when you simply reference a pure data file in the proper format) or implicitly (when you are gathering the information by doing a raw scan of a page), in an other than pure quant setting? A variant of the results may prove helpful to pure quants too, but that admittedly wasn't the goal this time around.

R is an environment which is predominantly used for statistical computing and data visualization. It is remarkably robust and reminds me of how powerful and useful the open source movement is for guys like us. It's not even that I have a huge list of packages I can use in addition to the already expansive list of functions R in the raw can handle. It's that I can very easily pull up the code underlying the functions, looking into the guts of sometimes quite complicated functions.

In this case, the ability to pop the trunk on R packages is what saves a couple of the functions in the fBasics package-- yahooImport and keystatImport. yahooImport was created to pull price data on an arbitrary number of stocks over an arbitrary number of days from yahoo finance. keystatsImport was created to pull the stock's current key statistics in a similar fashion. To put it frankly, they don't work properly at all anymore because Yahoo has changed the way that it references information on its site. By having access to their code, it took a few hours to not only fix the bugs but improve on the functions. For instance, why limit oneself to pulling key statistics? Why not pull industry-related information? Why not gather more detailed financial statement information? Why not gather all this information is a scalable way so that I can see how 1000 or more stocks co-evolve? The cool thing about these functions is that they allow you to essentially have access to a huge library of information without needing to have that data on your computer at all. You just rely on the fact that yahoo data is stored in a structured format-- as long as that is true (and yahoo doesn't run bots to kill your queries), then all you really need is an internet connection and zap, you've got the data in a piece of software which can cut the crap out of it.

My only real issue with yahoo is that it's only really good at providing you snapshot statistics when you're dealing with anything but price. There's no way for me to extend the mining to look at the past 50 years, let alone the past 20 (or 10)-- I'd get killed by survivorship bias, the fact that indicative data changes with high likelihood over long time horizons, and the lack of more robustly historical financial statement data. This makes it harder for value investors to reap some of the potential benefits of yahoo mining; no historical perspective. There may be value in analyzing pure price data in a fashion similar to this, linking the daily price data for, say, 2000 stocks with their corresponding indicative data, leveraging some of the other features on the site, aggregating in interesting ways, maybe going intra-day... but at this point that's not really my game.

Time to learn how to navigate password protected websites I guess. If anyone has any advice on sites or potentially useful things to find out, I would love to hear them. I make it a habit to share my results with the people who contribute, so it won't be a one way street.
-Dan

Wednesday, August 10, 2005

Systematic Value Investing

Being Systematic in a Quantitative Environment--
If there's one thing which I've learned from this past summer, it's the importance of being systematic. Large projects make it less and less possible to just bull through a project with code line by line on the fly. Suddenly you need pseudo-code and flowcharts to map your way to the end before even touching real code. By taking that step away from your programming language, pseudo-code and flowcharts leave you with that much more ability to focus on the bigger picture-- with the intention of zooming back in after you've mapped your path to the finish line out. To write out all that pseudo code it helps to use scalable and robust functions; functions which can handle minor, or even somewhat major, variations in the underlying dataset without bugging out. If you didn't, God knows how long your code would end up being. Also, God knows how much more difficult it becomes to debug! Finally, God knows how tedious things would get as you vary the datasets you are analyzing! Finally, large datasets make it important to have efficient functions so that your functions run in a timely manner. Flowcharts, pseudo-code and good functions support exploratory data analysis and not the other way around.

Application to Value Investing:
I'm of the opinion that these sort of ideas are not at all foreign to value investing, as long as we're able to differentiate between the following two dogmas-- "be systematic" and "be systematic when it's applicable to be that way." Just because I have a hammer doesn't mean that everything is a nail. Hell, I'll be technical when it's applicable to be so. I wish I believed in some 'one size fits all' truth which I could subscribe to. But I don't. I'm more of the belief that if there is some all-encompassing truth does exist, it's more of a tapestry, stitching together a vast number of distinct skills, skillsets, and rules, the breadth of which is so large that we can only hope to capture a sliver. That makes sense to me.

With that in mind I'd like to turn to how value investors and most corporations gather information. This is a realm which seems to me to be less systematically thought about than it probably should be. Let's say your boss goes up to you and says "Dan, I've found an interesting stock and the ticker symbol is XYZ. By the end of the day I want a complete write-up on this stock's business, competition, industry and prospects for the future" (I'm sure we've all had a variant of a situation like this).

It's things like this which I think merit a little more systematicity than they're given, on average. How can I be more systematic in my information gathering? Well, for one, it might be of value to do a thorough search of as many data providers as you can, sampling them all in an attempt to wean out new quality data sources, and then recording those sources, perhaps in some sort of information architecture on a local intranet where your respected co-workers can offer their insights as well with categories and comments. One could also classify all information along multiple lines, essentially creating multiple information architectures allowing you to flexibly cater to the task you may have at hand. Finally some sort of a search component is a must, so that you have yet another way to swipe through your information database, this time with a user-specified keyword.

This sort of ideation, taking a step back from the actual grunt process which we call 'information gathering', might not be pseudo-code in the technical sense, but it sure starts me along a path to create a system from which I can more easily gather and process information on an ongoing basis. The above description might not be a scalable function, but it seems to be a pretty scalable system because it supports and encourages iterative growth as members of the intranet add their comments and input over time. Finally, the above description might not be a robust function, but it seems to be a robust system because of its ability to classify information along multiple lines with a search capability, allowing the user to gather information in multiple ways over the wide range of goals those users may have.

Of course one doesn't need to do all of these things, but hopefully you can see how being systematic can be a good complement to however else you happen to gather information.

Being systematic can help with many other aspects of our investment activities-- it might be of value to think about this from your own perspective.

Comments are welcome!

Categories:

Monday, August 08, 2005

Re: Phillymag's "Is Wharton Ruining American Business?"-- Show Me the Comparables!

While I don't typically blog about news articles, this one merits a few comments because it's a good example of un-reasoned analysis. It reminds me of Nassim Taleb's disdain for journalism in Fooled By Randomness (one can get a feel for this disdain here perhaps?). Seeing as I'm from Wharton, perhaps I'm a little biased :)

The essential premise of the article was that Wharton MBA's obtain less of an eduation and are of abnormally low moral stature (hence the title of the article, "Is Wharton Ruining American Business?").

A number of statistics were brought up without comparables, so there was little ability to really get a feel for their significance on Wharton in particular relative to the overall average, or to the Ivy League average, or to Harvard, for example.

For example the number of actual names brought up of convicted or somehow 'sleazy' executives was relatively small, all things considered. And yet the high profile name of a guy like Rigas or Milken generates so much emotion to some that they don't realize that these people represent a small proportion of the overall Wharton population. How can one create a reasonable comparison across schools?

What I won't say is that all the points given in the article should be dismissed as one sided. That being said, the analysis is incomplete. If the author is going to say that Wharton's total applicant size has dropped 21%, it might be helpful to know what the comparable average was for other schools. It might be helpful to realize, for example, that business school applicant size is inversely related to the state of our economy (for example, the applicant pool for all schools was at record highs when the economy tanked). Overall, 2004 was a pretty good year. And $31.25 per hour at some pub for a handful of hours leading to a comparison to Grasso's $185M retirement package seems overblown.

Well reasoned articles are hard to come by. While I agree that ethics is something to keep a close eye on, and may be something that we should devote more money, time and effort towards, movement in that direction must start with rational, reasoned points that convincingly point to Wharton underperformance, and I don't see that type of analysis in this article. "A problem well specified is a problem half solved."

If Maureen is going to criticize Wharton in particular and not MBA's in general, I only see half the story.

Categories:

Saturday, August 06, 2005

Final Thoughts on Hakansson; Implications on Differential Cost and Ability

My last post attempted to wade through some thoughts on derivatives and their value as securities. I just had a few more.

Some believe that derivatives can add value through their very existence because of their ability to lower transaction costs. While Hakansson called the transaction cost argument "weak," I still honestly don't understand why.

This is how I see it- even when dealing with derivatives that are totally redundant, the existence of differential hedging ability and cost among market participants implies individual investors (and more generally the 'less efficient') can derive value from the creation of derivatives by efficient low cost hedgers. The reason is obviously because if person A can produce a payoff structure at a cost of X and person B can produce the same payoff structure at a cost of X + e, then person A can be of value to person B by A's creating the payoff structure for B and selling that at a price greater than X but less than X + e.

As long as a payoff structure is demanded by inefficient investors (suboptimal hedging ability, higher costs, or time constrained perhaps), then from a business perspective I don't see how an efficient bank doesn't add value to the marketplace by supplying that payoff structure at a market clearing cost (a function of competition, supply and demand-- gotta account for market impact and the fact that other people may be better than you).

The above discussion is part of a more general message- differences create opportunities. The above example is an almost dumbly obvious portrayal of differences in hedging ability and cost structure. That's something one can build a business on. Differences in perception is obviously another major one, and is probably most in line with what most people consider 'investing' to be. There are other far more subtle differences. Understanding the nature of differences seems to me to be extremely important. All else is rarely equal.

Categories:

Wednesday, August 03, 2005

Thoughts on Hakansson's Paradox

Hakansson’s so-called paradox (JoFQA; Hakansson, 1979) poses a somewhat skeptical question regarding the value of derivatives: if options can only be priced because they can be replicated, then, since they can be replicated, why are they needed at all?

Interesting question, but the more I think about it, the less of a paradox it becomes to an intelligent financial engineer.

It is true that in some sense, the true 'value' of a derivative is in part its ability to create novel payoff patterns relative to that which could have created with the underlying. Stated another way, their value is their ability to be "non-redundant", because if you can replicate the payoff perfectly then to you it isn't really of any economic value except for the fact perhaps that you can hedge efficiently.

But it seems legitimate to say that a derivative sells, all else equal, at a price proportional to the basis risk one expects to take on when hedging that security. Thus for example, if one expects to take on a ton of basis risk should there be a market dislocation (ie. GM correlation trade or CDS selling), one will sell that at a premium to compensate for the risk. All forms of risk should be compensated for properly so this makes sense.

Even though the value of derivatives is very heavily tied to the concept of dynamic replication, this by no means that "options can only be priced because they can be replicated," as was said in Taleb (note: Taleb doesn't make the claim himself and he by all means has 100x as strong a grasp of derivatives than me). As one moves away from that which can be replicated, the basis risk goes up, as does the premium one expects to pay due to basis risk, plus the hedging costs themselves for the optimal hedge done by the optimal hedger, adjusted for liquidity concerns (if one differentiates between pure basis risk and liquidity risk, which I admittedly have blurred a bit).

Variance swaps are a good example of this. One cannot purely trade the underlying. However it can be said (if I'm wrong let me know) that their heightened popularity relative to volatility swaps is due to the fact that it's easier to hedge variance swaps with a strip of options up and down the strike scale. Theoretically if one had a continuous distribution of strikes all up and down the strike scale and all were highly liquid you would arrive at the theoretical "value" of the variance swap. The real value accounts for the fact that some strikes are less liquid, making it more difficult to hedge. The real value also accounts for the fact that one can slide right off the strike scale should the underlying stock tank like a stone because strikes simply don't exist in certain areas. Whatever residual basis risk one expects to incur relative to the optimal hedge's actual hedging costs are accounted for.

A few conclusions I've reached:
1) Theoretical value assuming continuous rebalancing is only the first step, and sometimes it's no step at all;
2) There are a ton of other things to keep track of when determining what a derivative is worth like basis risk, liquidity risk, and supply/demand factors;
3) We pay in a very real sense for the 'value' of a derivative, where 'value' is defined to by uniqueness and non-redundancy of the payoff pattern, and this is a very logical cost. To the extent that a derivative is not redundant, one must compensate the originator of the derivative with a VaR basis risk argument; to the extent that a derivative *is* redundant, however, one must compensate the originator for his hedging costs.
4) When the market pays too much attention to theoretical replication and forgets about the basis and liquidity risk, supply and demand for certain derivatives over others, and other real world stuff along those lines, watch out.

Watch out, CDS. You are a one sided market. One sided markets are one sided until they are not.

Categories:

Tuesday, August 02, 2005

Unrelated: Creating Categories with del.icio.us and Technorati

Sorry for the unrelated entry; I thought it might be of value to bloggers in general.

Categories, IMHO, allow us bloggers to create preliminary forms of information architecture out of individual blogs. Some blogs are more similar than others, so it makes sense to create tags to try and account for those similarities and differences. Some other blog services may provide categories but I believe blogger doesn't.

This is as foolproof a writeup as I could put together describing how to create categories using Technorati and del.icio.us. I thought it might be helpful for some.

Go to Technorati's website. Create an account by clicking in top right to get here. Go through all the steps to create the account. After creating an account, go into your account and claim your blog where asked.

Now go to del.icio.us's website. Create an account here too by clicking on the register link at the top right. Put in the information and confirm the account.

Now for each blog entry you write up, you need to tag in two places, as far as I can tell. First, you need go put a little code in your actual blog entry. Second you need to post a bookmarklet on del.icio.us. Below I explain how to do the two things.
One:
Ted Ernst at his great website has created a very helpful little bit of code to create categories for your blogs. So lets say that for this entry I would like to classify it into "data" and "information_management", two of the tags created in del.icio.us. Then I go here where it says 'Technorati Delicious Bookmarklet', click on the link, and type in "data information_management". You get some code as your output.

Now you need to replace the references to tedernst with your username for the del.icio.us account. Just put that code directly into your blog entry as I have done below.

Two:
Go back into your del.icio.us account and Click on "Post" in the top right. Copy and paste in the url of the blog entry you just wrote. The site then asks for a descriptoin as well as the tags you want. For this entry, I again put in information_management, data. Tags cannot have whitespace in between them, which is why I use '_' for tags with multiple words. You can choose whatever tags you think are most appropriate.

Then you you should be good to go. When you click on the category from a blog entry you should be able to see all the other blog entries you've written which are in the same category.

If I've done anything wrong just let me know! This is an evolving entry (as usual).
-Dan
PS. Watch out for stray commas. They can screw things up.


Categories: